Overview
The Analytics section displays various metrics about your form, like completion rate, number of submissions, total views per page, and more. You can also see how many completed submissions your forms are receiving per day.How to view analytics
Open a form and navigate toResults on top. Click Analytics. Here, you’ll see:
- Unique Visitors - number of individual respondents who viewed your form, each counted only once no matter how many times they visit
- Started - number of times your form was started but left incomplete
- Finished - number of times your form has been completed
- Completion rate - number of finished submissions divided by number of unique visitors
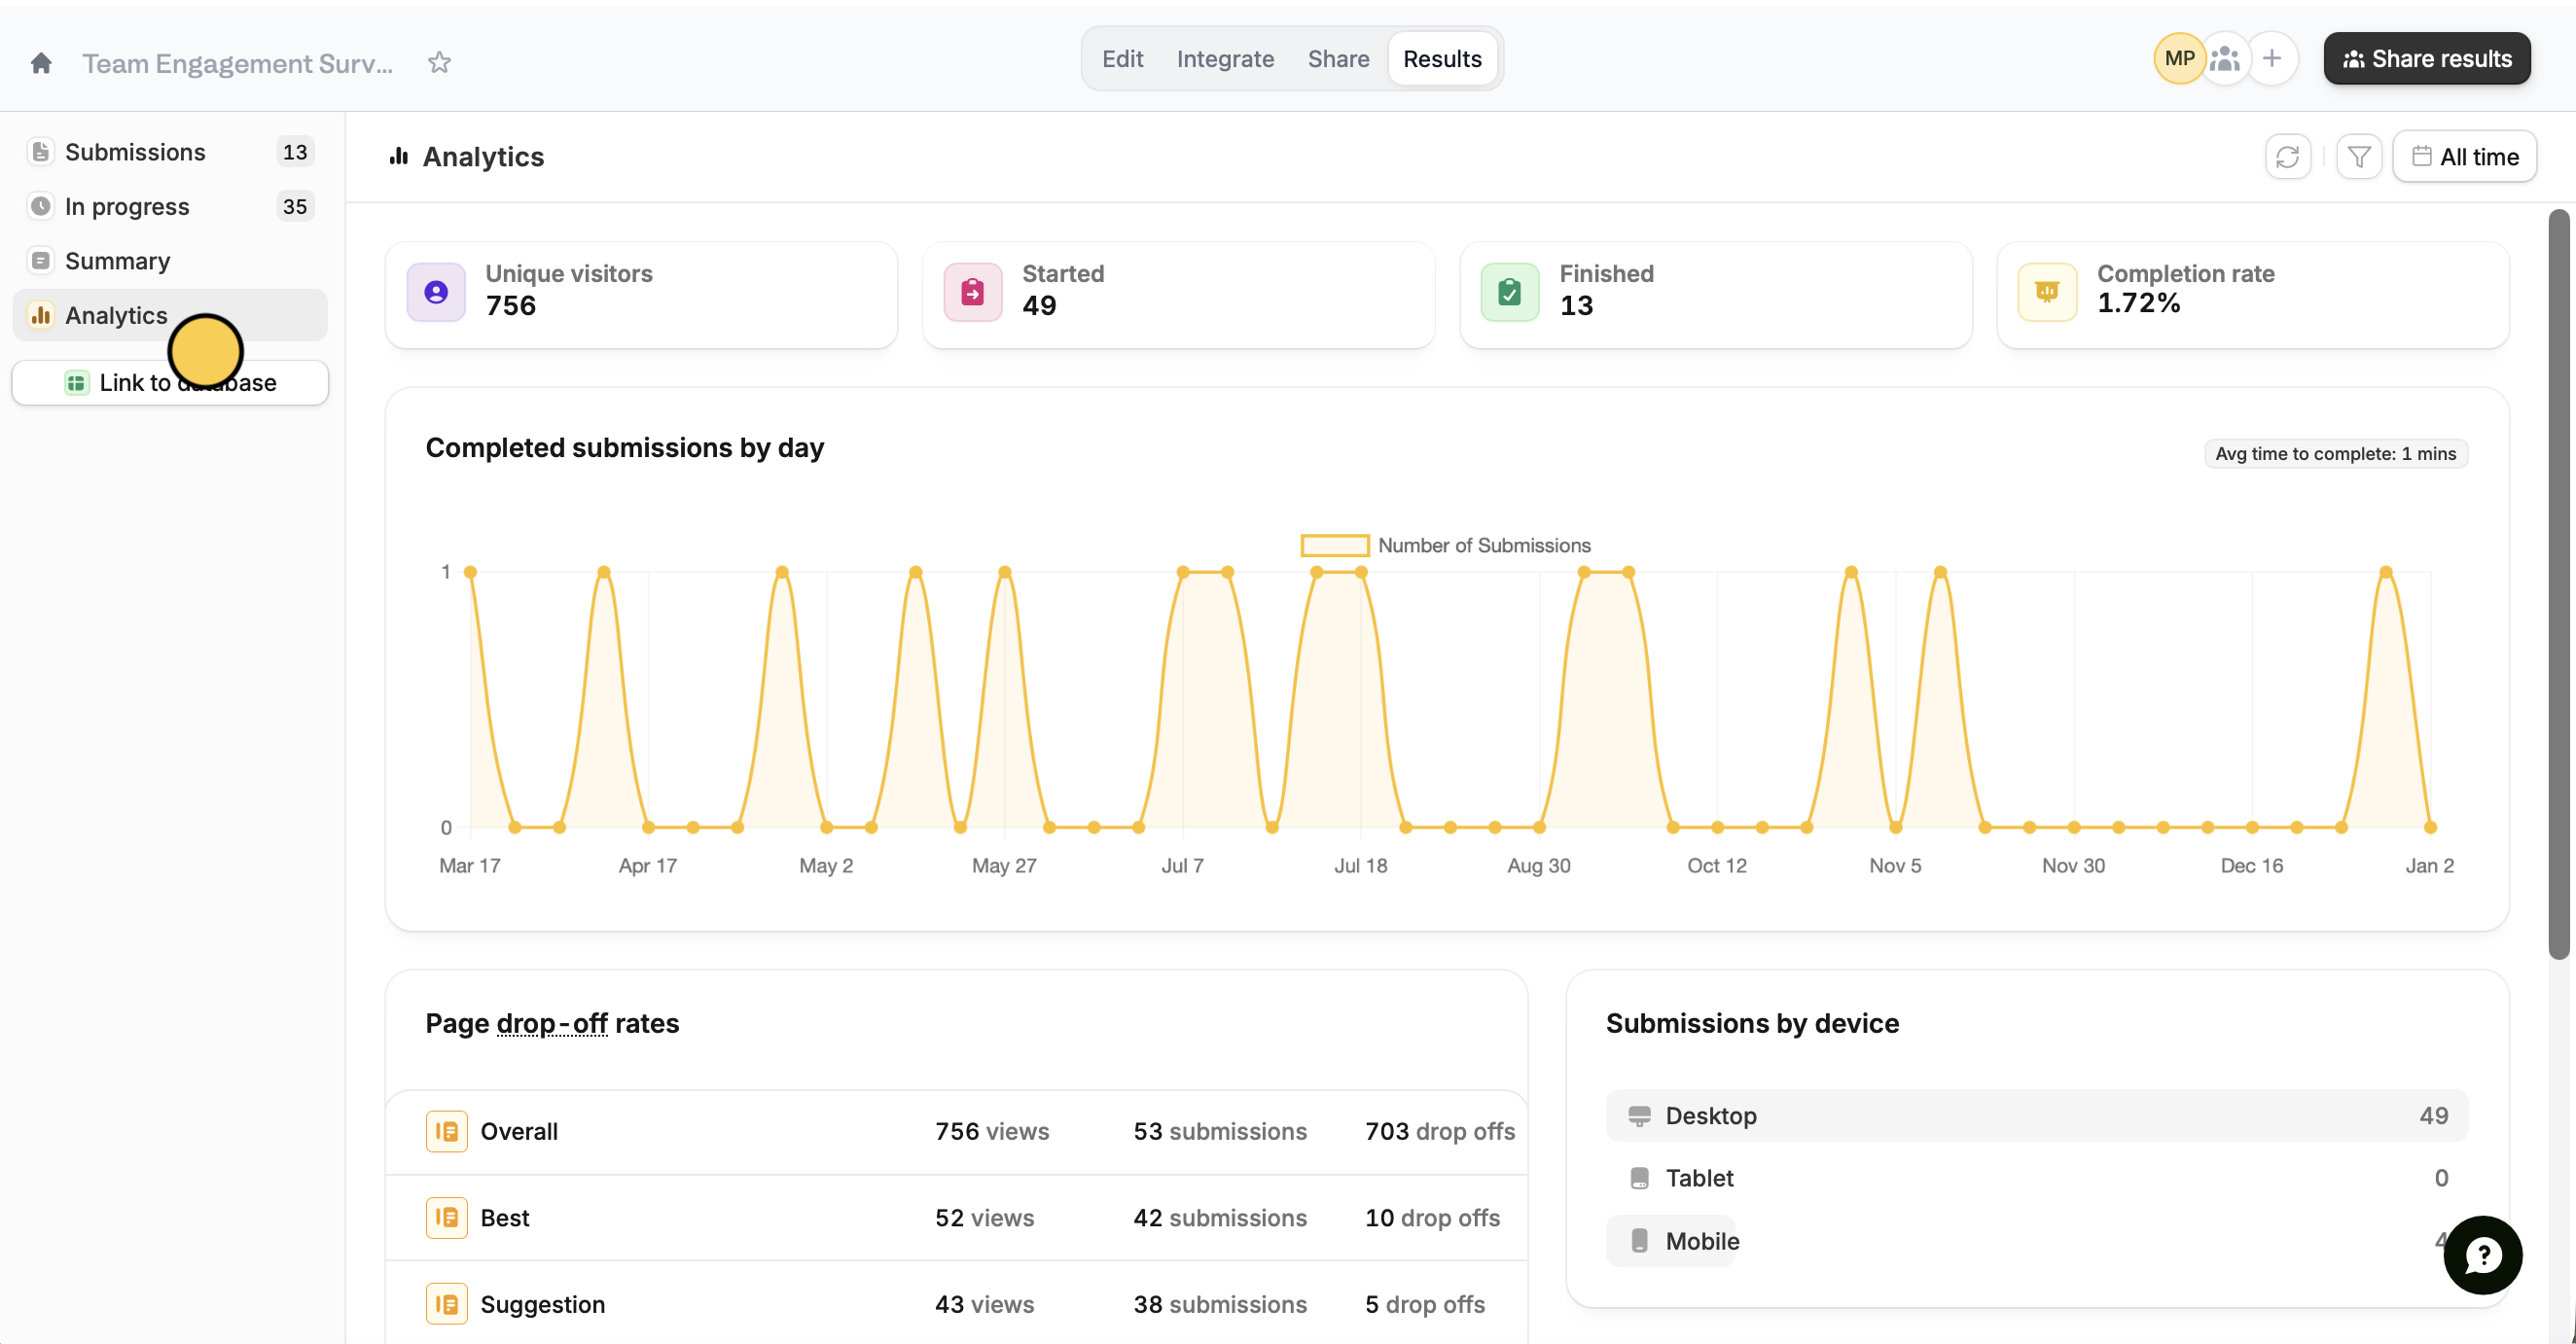
Check page drop-off rates
Page drop-off rates shown at the bottom help you determine if and where respondents are abandoning your forms. In the example below, the Overall page has the highest number of drop-offs.
Viewing page drop-off information is available on the Business plan and above. Learn more here.